Forex markets
demonstrate exchanges between different currencies and their prices relative to
that exchange. Understanding charts are very important and can be an extremely
useful tool in trading Forex. Prior to learning how to read them and how you
can use them to make money trading, you should understand what exactly goes on
in a forex market chart.
Charts Are Relative to
a Parameter – Foreign
exchange market charts are always relative to a certain parameter. The most
basic chart type in Forex, which you’ll also be using the most, is the standard
line graph. A line graph houses two axis, the X-Axis, and the Y-Axis. Charts
demonstrate something. The most common chart, a line graph, shows the
performance of one parameter over the length of a different parameter.
The most common chart
in Forex trading is the performance of a currency pair over a said period of
time. In this case, we can determine the following parameters are used to
demonstrate a chart for how the price of a currency pair performs over time.
The parameters used in this case are:
1.) The trading pair
2.) The exchange rate (price) of the trading pair, 3.) Length of time the exchange
rate of the trading pair has been recorded. In the most standard and most
likely used average format of this type of chart, the parameters are used in
the following notion; on the Y-Axis, you have a scale that shows the prices
that the trading pair has previously obtained. On the X-Axis, you have a start
date for where the data recording starts, and then an end date for when the
data ends.
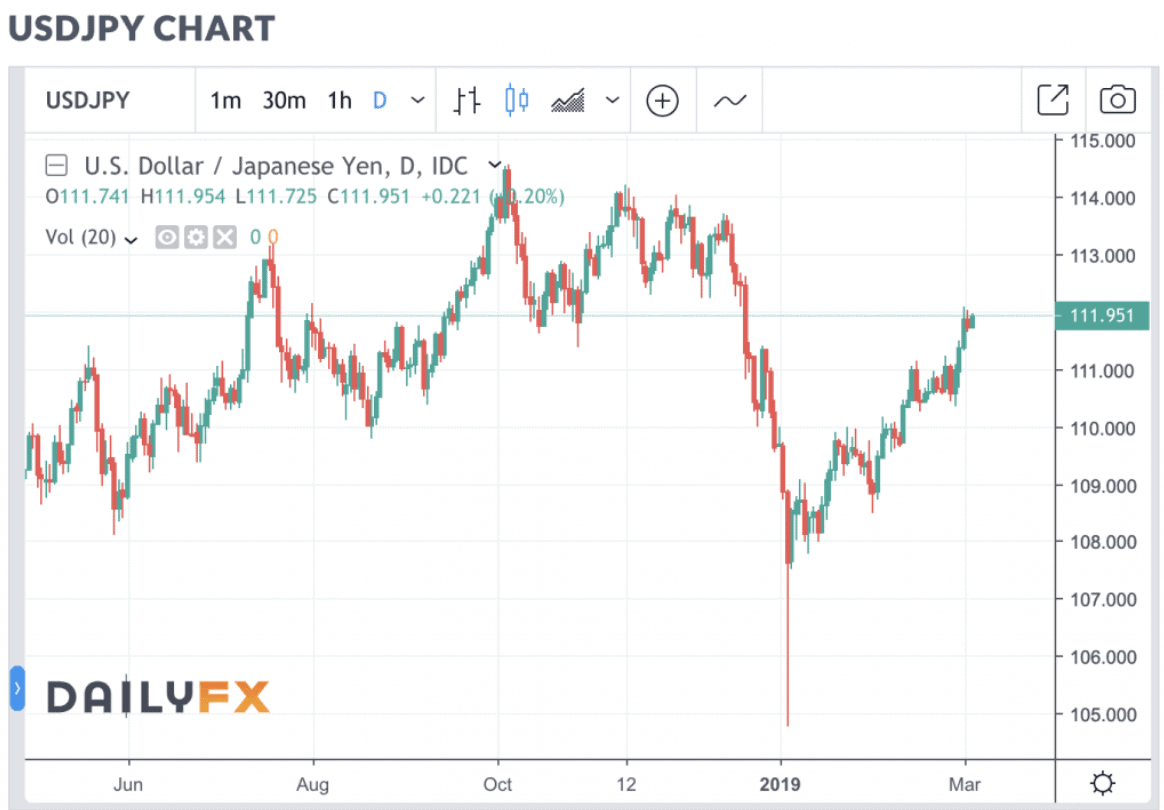
Let’s look at the
above chart of USD/JPY courtesy of DailyFX. At
the title of each graph, you will have an overview indication of what it is
you’re looking at. In this case, this is the chart for the price of “USD/JPY“,
in other words, the amount of USD that can be exchanged for JPY over the period
of a year. On the X-Axis you can see the time indications, which are marked by
Months (Time).
Then as we previously
mentioned, on the Y-Axis, we have the price points at which the USD/JPY pair
has attained.
Now, let’s delve a bit
deeper into the graph. The exact price points may simply look like the prices
at which USD/JPY has obtained previously, correct? Yes and no. The above chart
is one of the most used and probably most important chart type that you’ll come
across, called a Candlestick Chart.
A candlestick chart is
a type of chart that shows the performance of a currency over time through the
form of “candlesticks”. Candlesticks are visual representations of price
movements of an underlying currency from its open price, close price, as well as
its price increase/decrease relative to the price of the currency on the
previous close. This might sound confusing at first, but let’s dive in;
candlesticks are a concept that can only be learned with practice.
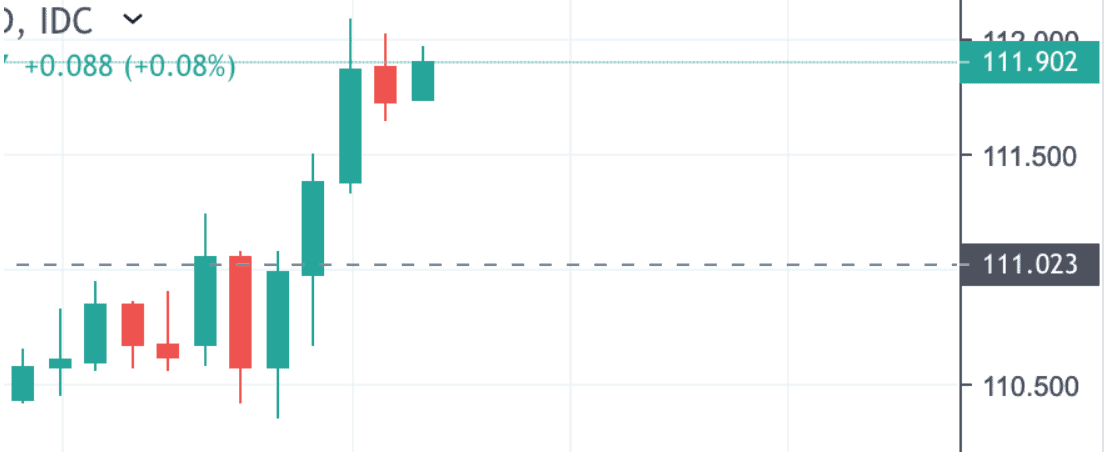
A candlestick
represents a singular time mark relative to the time preference you’ve set. If
you open a “Daily” candlestick chart, each candlestick that you see on the
chart will be representative of a “Day” of price movement. Let’s look at a
zoomed in version of the USD/JPY chart, which looks like so:
Looking at this chart,
each candlestick represents a “Day” of price movement for the USD/JPY pair.
Each green candlestick means that on this “Day”, the price of USD/JPY closed
higher than what it closed on the day before unless we are talking about the
most present candlestick on a candlestick chart. In this case, the candle will
be green or red depending on whether or not the price on a “Day” opens relative
to the previous day. If it opens higher, then in realtime the candle will
appear green.
The following image,
provided by Investopedia,
demonstrates the anatomy of a candlestick on a chart.
The topmost part of
the candlestick indicates the highest price achieved by the pair during the
day; the second topmost is which price the pair opened or closed the day at;
the body of the candle extends only as far as the fluctuation in price during
the day. The bottom of the body indicates the subsequent open or closing, and
then finally, the bottommost part of the candle represents the lowest price
attained during the trading period.
Analyzing these sorts
of charts are necessary to get a better grasp for Forex trading but are also
extremely necessary for learning how to maneuver any financial market. Learning
the functionality and basis of a candlestick chart will be invaluable in your
overall trading.
The second chart that
should be understood is the basic line chart. With (Hopefully) newfound
knowledge in Candlestick Charts, understanding basic line charts will be easy.
Line charts are primarily useful in Forex trading for a preliminary overview of
price action. If there are 4 trading screens open across your trading desk, you
may not want to know the exact details associated with price action that
candlesticks provide. Sometimes you simply want to know the general direction.
Basic line graphs are excellent for that purpose.
A line graph displays
data in a similar manner as a Candlestick Chart. A basic line graph/chart will
overview the price of a certain trading pair over a certain time period.
However, it will only ever demonstrate a singular parameter through the chart:
which is the close price of the trading pair. Here is the same trading pair we
viewed earlier with a candlestick layout, except now replaced with a basic line
setup.
Here you can see we
have a very broad overview instead of exact closes, opens, and daily movements,
and sometimes that’s the only thing you want when looking at a trading pair.
This chart is extremely simple in terms of composition: on the Y-Axis, we have
the price of the range of prices the trading pair has previously attained, and
then on the X-Axis we have our variable of time, which is in months for this
specific graph.
Reading Forex charts
is essential, and with this basic understanding, you should have the capability
to make very brief and preliminary inferences, such as “This trading pair has
been declining in price for over 2 months now”, or “This trading pair dipped
down today after increasing for over 3 weeks, maybe now is a good time to trade
upward.” Of course, nothing is set in stone; however, comprehending Forex
charts will allow you to reach a level of knowledge in trading and analysis
that can be very helpful in making profit


