BTCUSD Medium-term Trend: Ranging
Resistance: $7,100, $7,000, $6,900
Support: $6,500, $6,600, $6,700
Yesterday, April 9, the price of Bitcoin was
in a bullish trend. Bitcoin traded up to $7,200 before the bears took
control of the market and brought price to its low at $6,786.67. Price has resumed its range bound
movement because neither the bulls, nor the bears have control of price. From
the weekly chart, the support at $6,500 and the resistance at $7,500
have been strong key levels for the price of Bitcoin.
These key levels have been
holding since March 30, 2018. The bears have been resisted by the bulls at the
support level; therefore price is expected to rise again or fluctuates. Traders
can adopt a range bound strategy in a situation where price is in a range bound
movement. I don’t see price breaking the support level but if it does traders
should short their positions.
I expect price to rise again or fluctuates
in a range bound movement. Now look at the weekly chart. If you had followed
the range bound movement since March 30, 2018, you would have had the
opportunity of placing two long trades and a short trade. In a range bound
strategy, you take a long trade at the support level and exit near the
resistance zone.
On the other hand, you take a
short trade at the resistance level and exit near the support zone.
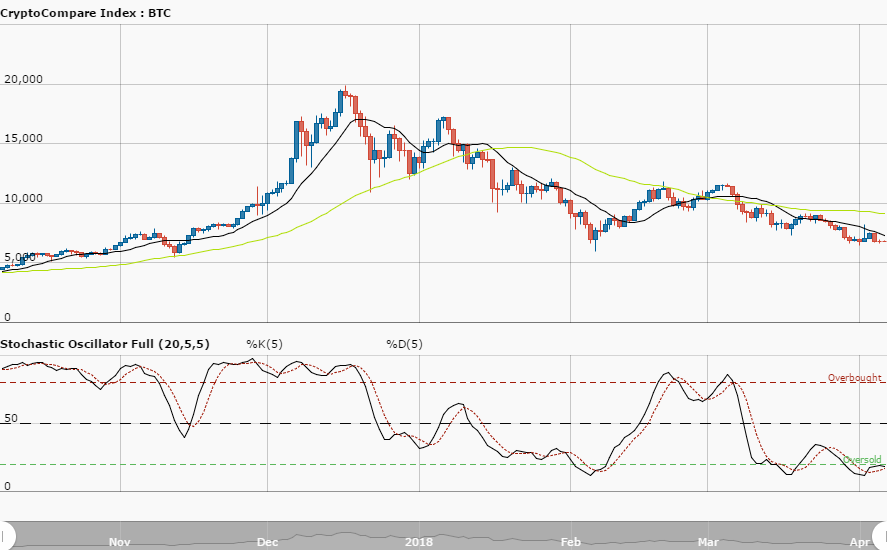
BTCUSD Short-term Trend: Ranging
From the daily chart, the BTCUSD
pair is in a range bound movement. Price is oscillating between the resistance
at $6,800 and the support at $6,600.
The views and
opinions expressed here do not reflect that of CryptoGlobe.com and do not
constitute financial advice. Always do your own research.
Source: https://www.cryptoglobe.com/markets/price-analysis/
No comments:
Post a Comment